File:Stability Diagram.png
From Vigyanwiki
Size of this preview: 800 × 519 pixels. Other resolutions: 320 × 208 pixels | 640 × 415 pixels | 1,024 × 664 pixels | 1,196 × 776 pixels.
Original file (1,196 × 776 pixels, file size: 106 KB, MIME type: image/png)
Summary
| Description |
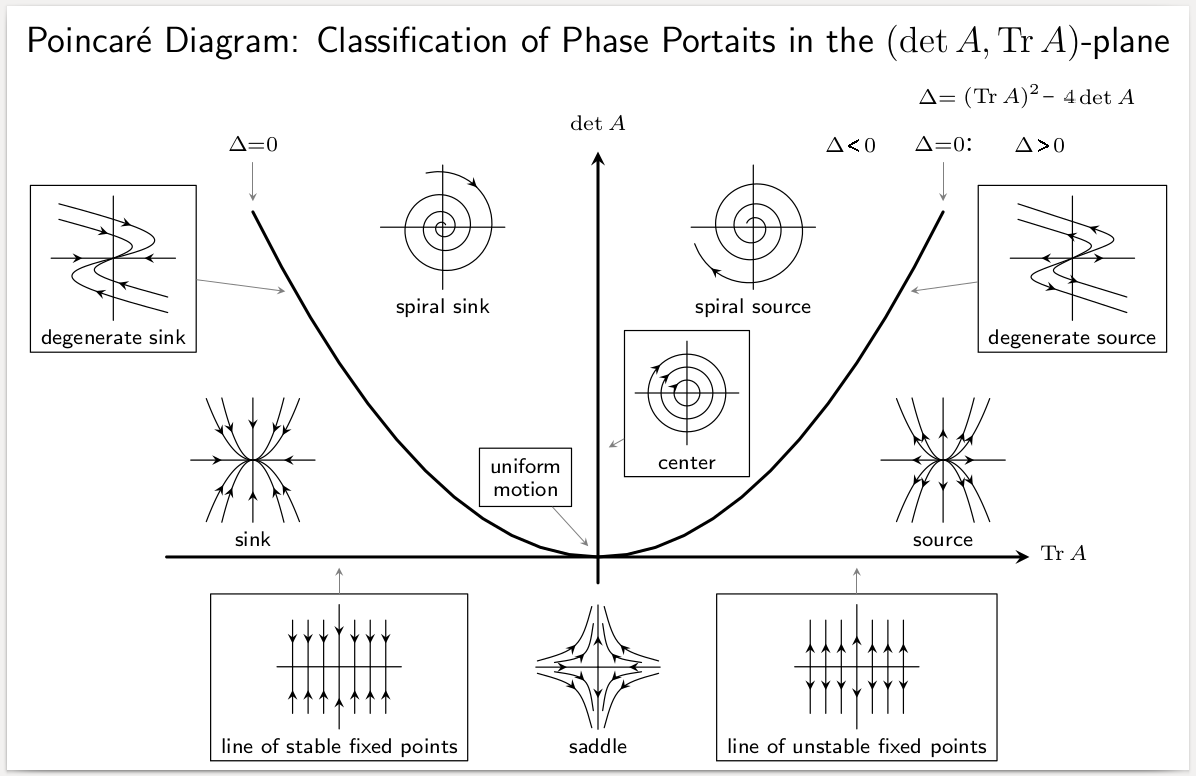
English: Stability Diagram.
Trace-determinant plane for classifying phase portraits in 2D linear dynamical systems. Stability diagram classifying Poincaré maps of linear autonomous system as stable or unstable according to their features. Stability generally increases to the left of the diagram.[1] Some sink, source or node are equilibrium points. |
| Date | 4/2/2018 |
| Source | Gimp |
| Author | Freesodas |
| Other versions |
|


Licensing
I, the copyright holder of this work, hereby publish it under the following licences:

|
Permission is granted to copy, distribute and/or modify this document under the terms of the GNU Free Documentation Licence, Version 1.2 or any later version published by the Free Software Foundation; with no Invariant Sections, no Front-Cover Texts, and no Back-Cover Texts. A copy of the licence is included in the section entitled GNU Free Documentation Licence. |
This file is licensed under the Creative Commons Attribution-Share Alike 4.0 International licence.
- You are free:
- to share – to copy, distribute and transmit the work
- to remix – to adapt the work
- Under the following conditions:
- attribution – You must give appropriate credit, provide a link to the licence, and indicate if changes were made. You may do so in any reasonable manner, but not in any way that suggests the licensor endorses you or your use.
- share alike – If you remix, transform, or build upon the material, you must distribute your contributions under the same or compatible licence as the original.
You may select the licence of your choice.
- ↑ Egwald Mathematics - Linear Algebra: Systems of Linear Differential Equations: Linear Stability Analysis Accessed 10 October 2019.
File history
Click on a date/time to view the file as it appeared at that time.
| Date/Time | Thumbnail | Dimensions | User | Comment | |
|---|---|---|---|---|---|
| current | 09:46, 8 January 2021 | | 1,196 × 776 (106 KB) | wikimediacommons>Rockyunited | clearly defined delta |
File usage
The following 2 pages use this file: