File:Pink noise 1d autocorrelation.png
From Vigyanwiki
Size of this preview: 406 × 599 pixels. Other resolutions: 325 × 480 pixels | 521 × 768 pixels | 694 × 1,024 pixels | 2,402 × 3,542 pixels.
Original file (2,402 × 3,542 pixels, file size: 942 KB, MIME type: image/png)
Summary
| Description |
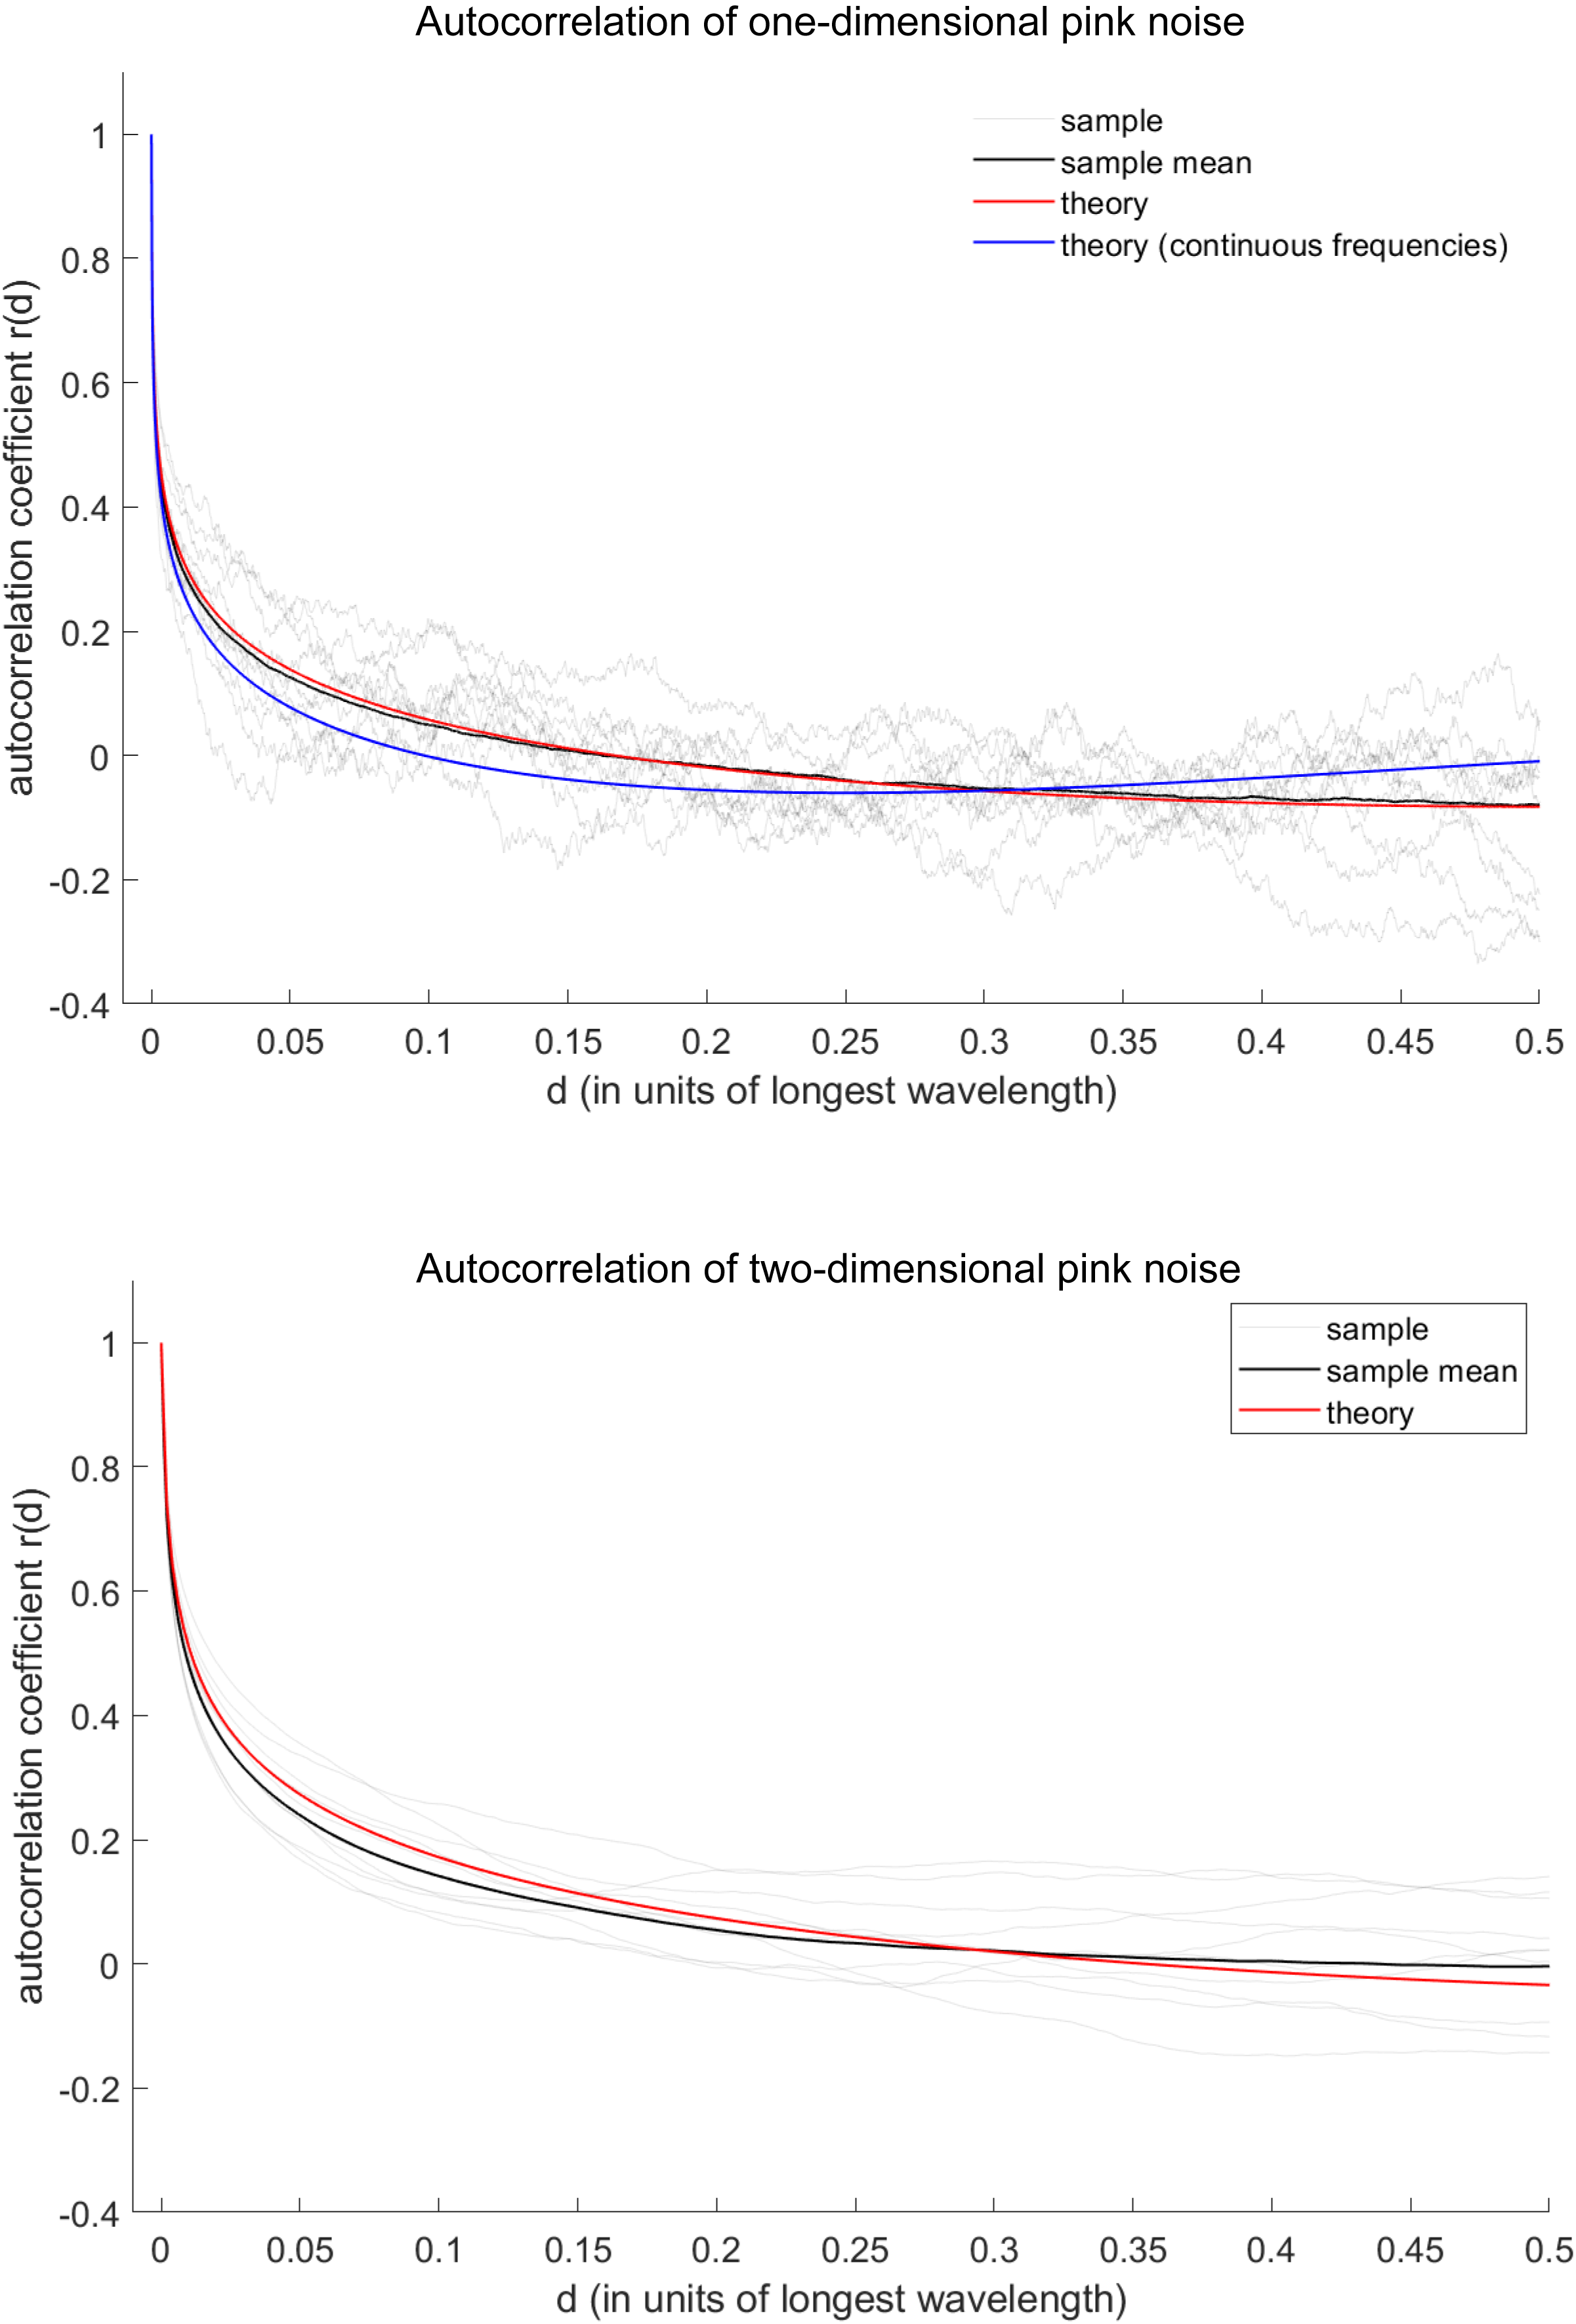
English: The autocorrelation (Pearson's correlation coefficient) of one-dimensional (top) and two-dimensional (bottom) pink noise signals, across distance d (in units of the longest wavelength comprising the signal). Grey curves are the autocorrelations of a sample of pink noise signals (comprising discrete frequencies), and black is their average. Red is the theoretically calculated autocorrelation when the signal comprises these same discrete frequencies, and blue assumes a continuum of frequencies. |
| Date | |
| Source | Own work |
| Author | Dvidby0 |
Licensing
I, the copyright holder of this work, hereby publish it under the following licence:
This file is licensed under the Creative Commons Attribution-Share Alike 4.0 International licence.
- You are free:
- to share – to copy, distribute and transmit the work
- to remix – to adapt the work
- Under the following conditions:
- attribution – You must give appropriate credit, provide a link to the licence, and indicate if changes were made. You may do so in any reasonable manner, but not in any way that suggests the licensor endorses you or your use.
- share alike – If you remix, transform, or build upon the material, you must distribute your contributions under the same or compatible licence as the original.

|
This media file is uncategorised.
Please help improve this media file by adding it to one or more categories, so it may be associated with related media files (how?), and so that it can be more easily found.
Please notify the uploader with {{subst:Please link images|File:Pink noise 1d autocorrelation.png}} ~~~~ |
File history
Click on a date/time to view the file as it appeared at that time.
| Date/Time | Thumbnail | Dimensions | User | Comment | |
|---|---|---|---|---|---|
| current | 00:31, 23 November 2022 | | 2,402 × 3,542 (942 KB) | wikimediacommons>Dvidby0 | corrected plots |
File usage
The following page uses this file: