File:CurveWeightHeight.png
From Vigyanwiki
Size of this preview: 800 × 492 pixels. Other resolutions: 320 × 197 pixels | 640 × 393 pixels | 1,199 × 737 pixels.
Original file (1,199 × 737 pixels, file size: 97 KB, MIME type: image/png)
Summary
| Description |
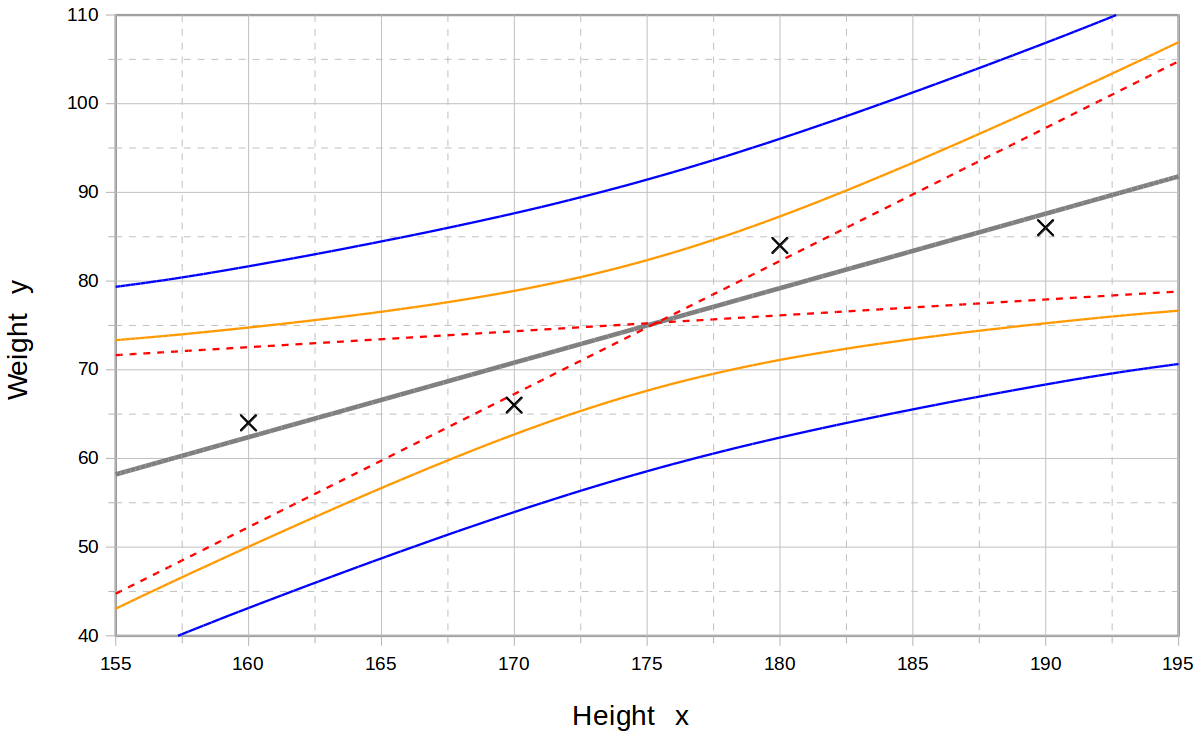
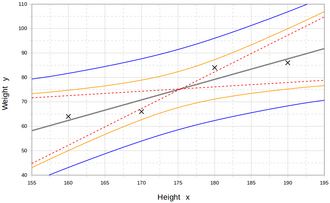
English: Linear Regression. In the middle, the interpolated straight line represents the best balance between the points above and below this line. The dotted lines represent the two extreme lines. The first curves represent the estimated values. The outer curves represent a prediction for a new measurement. |
| Date | |
| Source | Own work |
| Author | Mathieu ROUAUD |
From the book : Probability, Statistics and Estimation (Mathieu Rouaud, 2013).
Licensing
I, the copyright holder of this work, hereby publish it under the following licence:
This file is licensed under the Creative Commons Attribution-Share Alike 4.0 International licence.
- You are free:
- to share – to copy, distribute and transmit the work
- to remix – to adapt the work
- Under the following conditions:
- attribution – You must give appropriate credit, provide a link to the licence, and indicate if changes were made. You may do so in any reasonable manner, but not in any way that suggests the licensor endorses you or your use.
- share alike – If you remix, transform, or build upon the material, you must distribute your contributions under the same or compatible licence as the original.
File history
Click on a date/time to view the file as it appeared at that time.
| Date/Time | Thumbnail | Dimensions | User | Comment | |
|---|---|---|---|---|---|
| current | 14:44, 18 June 2017 | | 1,199 × 737 (97 KB) | wikimediacommons>Mathieu137 | User created page with UploadWizard |
File usage
The following page uses this file: