File:Butterworth Filter Orders.svg
From Vigyanwiki
Original file (SVG file, nominally 850 × 600 pixels, file size: 95 KB)
Summary
| Description |
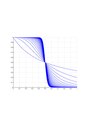
English: A frequency-response graph of low-pass butterworth filters of orders from 1 to 5. The break frequency is normalised to 1 rad/s, and the DC-gain is normalised to 0dB. (Note: this is the power gain G² not the amplitude gain.) |
| Date | |
| Source | Own work |
| Author | Inductiveload |
| Other versions |
|
| SVG genesis |


Licensing
| This work has been released into the public domain by its author, Inductiveload. This applies worldwide. In some countries this may not be legally possible; if so: Inductiveload grants anyone the right to use this work for any purpose, without any conditions, unless such conditions are required by law. |
Source code
<<Graphics`Graphics`
butterworth[w_, w0_, o_] = 1/(1 + (w/w0)^(2*o));

LogLinearPlot[
  Evaluate[Table[
      10*Log[10, butterworth[w, 1, ord]],
      {ord, 5}]],
  {w, 0.01, 100},
  PlotRange -> {-100, 0},
  PlotPoints -> 100,
  ImageSize -> 800]
File history
Click on a date/time to view the file as it appeared at that time.
| Date/Time | Thumbnail | Dimensions | User | Comment | |
|---|---|---|---|---|---|
| current | 04:15, 19 October 2007 | No thumbnail | 850 × 600 (95 KB) | wikimediacommons>Inductiveload | {{Information |Description=A frequency-response graph of w:butterworth filters of orders from 1 to 5. The break frequency is normalised to 1 rad/s, and the DC-gain is normalised to 0dB. |Source=Self-made |Date=18/10/2007 |Author= [[User:Inductiveload |
File usage
The following 2 pages use this file: